Note
Click here to download the full example code
Hammersley 2D-plane
Hammersley points are a series of pseudo random points with a low discrepancy that are suitable for use in solid state NMR simulations where powder averaging is performed.
References
Hammersley, J. M.; Handscomb, D. C. (1964). Monte Carlo Methods. doi:10.1007/978-94-009-5819-7
Tien-Tsin Wong, Wai-Shing Luk & Pheng-Ann Heng (1997) Sampling with Hammersley and Halton Points, Journal of Graphics Tools, 2:2, 9-24, doi: 10.1080/10867651.1997.10487471
Examples of Hammersley points for tiling a 2-D plane
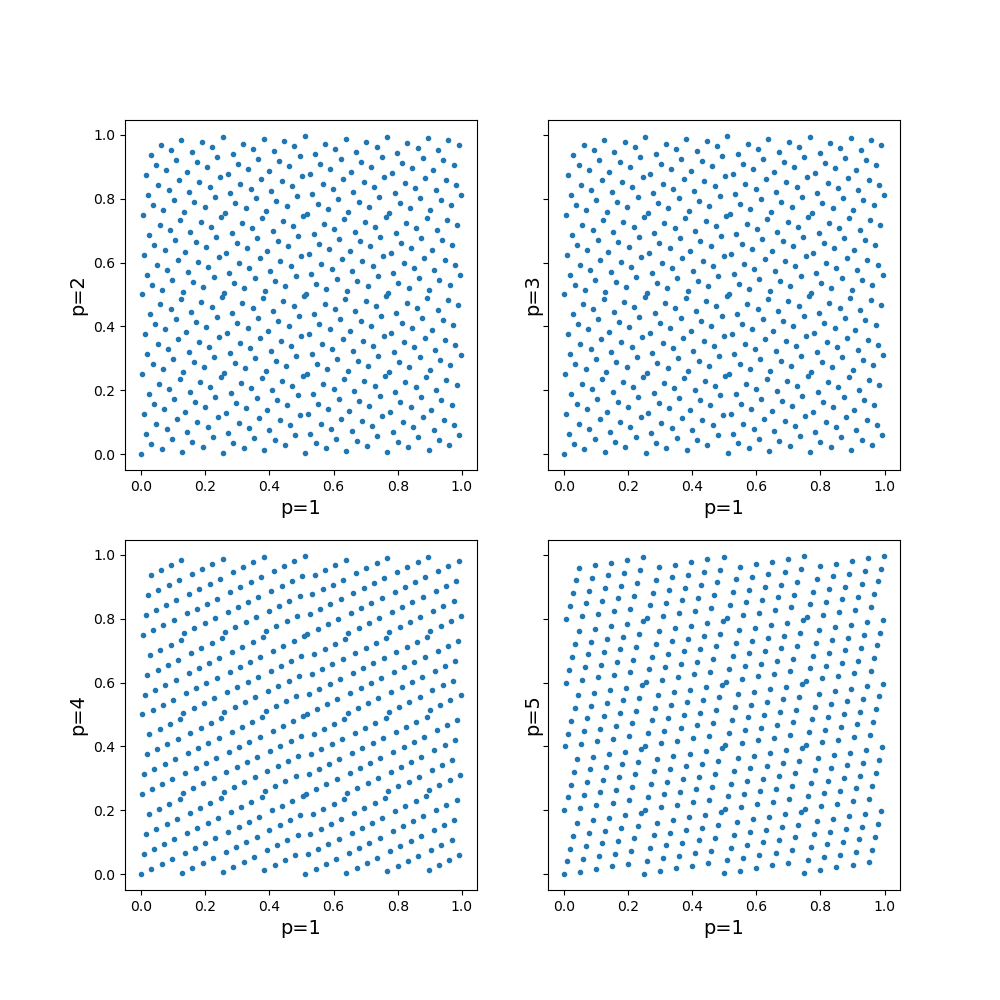
Out:
C:\Users\ERIC\Documents\pygamma_gallery\docsource\sphinx\examples\hammersleypoints\plot_hammersley_points.py:82: UserWarning: Matplotlib is currently using agg, which is a non-GUI backend, so cannot show the figure.
  plt.show()
import numpy as np
from matplotlib import pyplot as plt


def return_point(m, n, p):
    """
    m is the index number of the Hammersley point to calculate
    n is the maximun number of points
    p is the order of the Hammersley point, 1,2,3,4,... etc
    l is the power of x to go out to and is hard coded to 10 in this example
    :return type double
    """

    if p == 1:
        return m / n

    v = 0.0

    for j in range(10, -1, -1):
        num = m // p ** j

        if num > 0:
            m -= num * p ** j
            v += num / (p ** (j + 1))

    return (v)

if __name__ == "__main__":

    npts = 500
    h_1 = np.zeros(npts)
    h_2 = np.zeros(npts)
    h_3 = np.zeros(npts)
    h_4 = np.zeros(npts)
    h_5 = np.zeros(npts)
    h_7 = np.zeros(npts)

    for m in range(npts):
        h_1[m] = return_point(m, npts, 1)
        h_2[m] = return_point(m, npts, 2)
        h_3[m] = return_point(m, npts, 3)
        h_4[m] = return_point(m, npts, 4)
        h_5[m] = return_point(m, npts, 5)
        h_7[m] = return_point(m, npts, 7)

    fig, axs = plt.subplots(2, 2, figsize=(10, 10), sharey=True)

    ax =axs.flatten()

    ax[0].plot(h_1, h_2, '.')
    ax[1].plot(h_1, h_2, '.')
    ax[2].plot(h_1, h_4, '.')
    ax[3].plot(h_1, h_5, '.')
    ax[0].set_xlabel("p=1", fontsize=14)
    ax[0].set_ylabel("p=2", fontsize=14)
    ax[1].set_xlabel("p=1", fontsize=14)
    ax[1].set_ylabel("p=3", fontsize=14)
    ax[2].set_xlabel("p=1", fontsize=14)
    ax[2].set_ylabel("p=4", fontsize=14);
    ax[3].set_xlabel("p=1", fontsize=14)
    ax[3].set_ylabel("p=5", fontsize=14);


    plt.show()
Total running time of the script: ( 0 minutes 0.174 seconds)